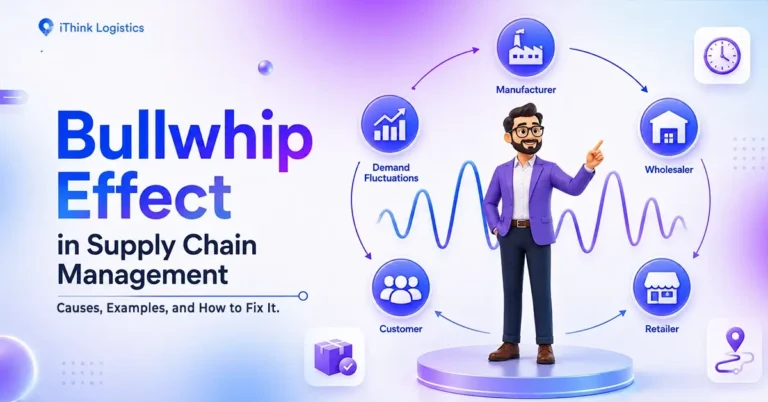
A small jump in customer demand can turn into a much larger spike in factory orders. That distortion has a name: the bullwhip effect in supply chain management.
It happens when small demand changes get amplified as they travel from retailers up to manufacturers.
This guide breaks down why that happens, how to measure it, and what demand distortion can look like inside Indian D2C fulfillment.
In this guide:
- What the bullwhip effect actually is
- How to measure it with the Bullwhip Ratio
- The four causes behind it.
- What it looks like in Indian D2C ecommerce
- Its effects on the supply chain
- The reverse bullwhip effect
- How to reduce it
- FAQs
What Is the Bullwhip Effect?
The bullwhip effect is the tendency for small changes in customer demand to create progressively larger swings in orders, inventory, and production as information moves upstream through the supply chain, from retailer to wholesaler to manufacturer.
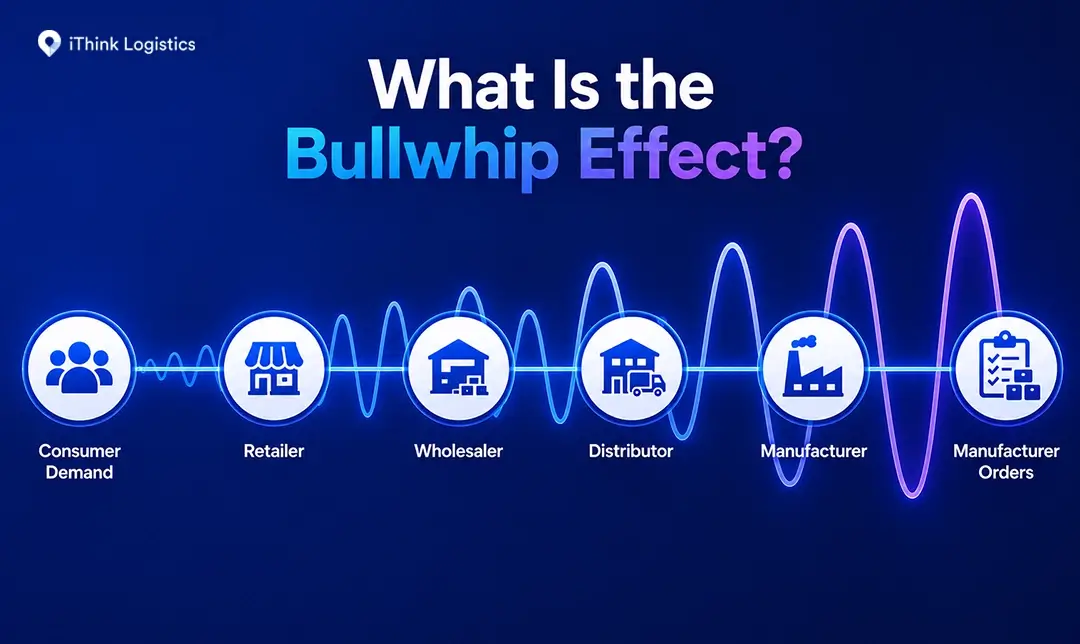
For example, a small piece of news gets exaggerated every time someone repeats it. A supply chain works the same way: a small sales bump gets exaggerated every time one business orders more from the next.
Procter & Gamble first documented this in the 1990s, after noticing that factory orders for Pampers swung far more than actual diaper sales. Researchers Hau Lee, V. Padmanabhan, and Seungjin Whang studied why in a 1997 paper that’s still the reference point for this topic.
That explains what the effect is. The next question is how you’d spot it in your own numbers.
The Bullwhip Ratio: How to Measure It
The Bullwhip Ratio equals the variance of orders placed upstream divided by the variance of actual end-customer demand.
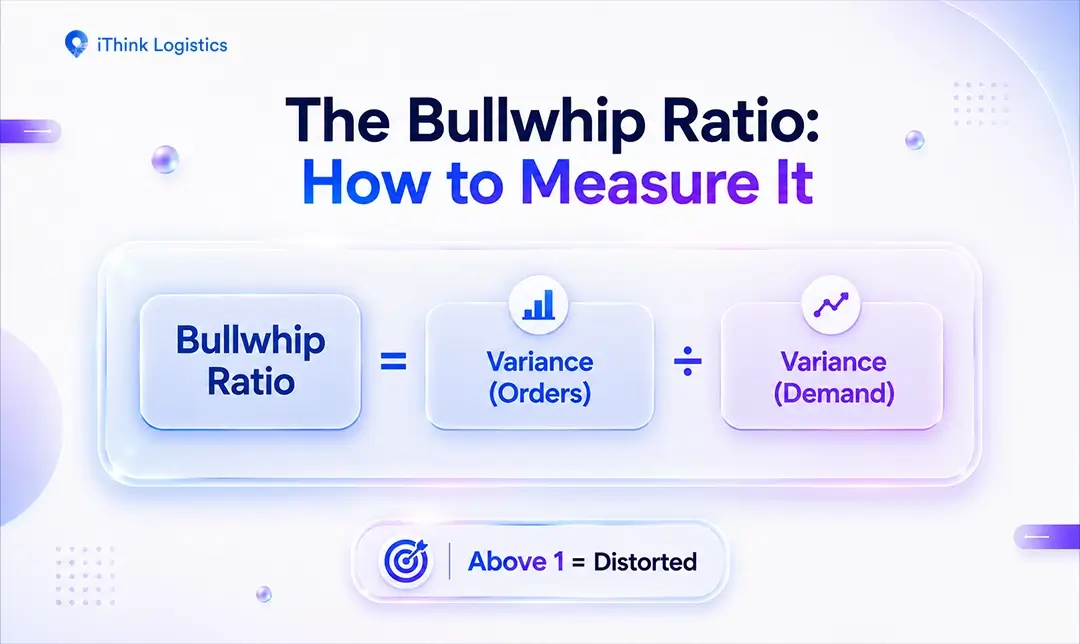
Bullwhip Ratio = Variance (Orders) ÷ Variance (Demand)
Quick note on that word “variance,” since it’ll come up a few times: it just means how much something jumps around instead of staying steady. If your sales are 100, 102, 98, 101 every week, that’s low variance, pretty stable. If they’re 100, 40, 160, 70, that’s high variance, all over the place. Every time you see “variance” from here on, just read it as “how much this number swings around.”
Here’s where the ratio actually comes from. Imagine your customer demand each month looks like this: 100, 105, 95, 100. That’s fairly steady, low variance. Now imagine the orders you place with your supplier each month look like this: 100, 160, 40, 100. Same average, but wildly swinging, much higher variance.
Example:
Variance (Demand) = 20
Variance (Orders) = 60
Bullwhip Ratio = Variance (Orders) ÷ Variance (Demand)
Bullwhip Ratio = 60 ÷ 20
Bullwhip Ratio = 3
That 3 means your orders are swinging three times more than your actual customer demand ever did.
- Ratio above 1: your orders are swinging more than your real demand does. The higher above 1, the worse the distortion.
- Ratio of 3: like the example above, your order variance is three times your demand variance. You’re overreacting to demand changes that were never that big in the first place.
You don’t need a data science team to start measuring it. You need your own order numbers and your own sales numbers over a few months, side by side. If your reorder quantities swing far more than your actual sales ever do, that’s worth investigating.
Knowing the ratio tells you something is off. Understanding why it climbs in the first place is where the fix starts.
What Causes the Bullwhip Effect?
Four causes show up again and again in the research, and each one adds its own layer of distortion.
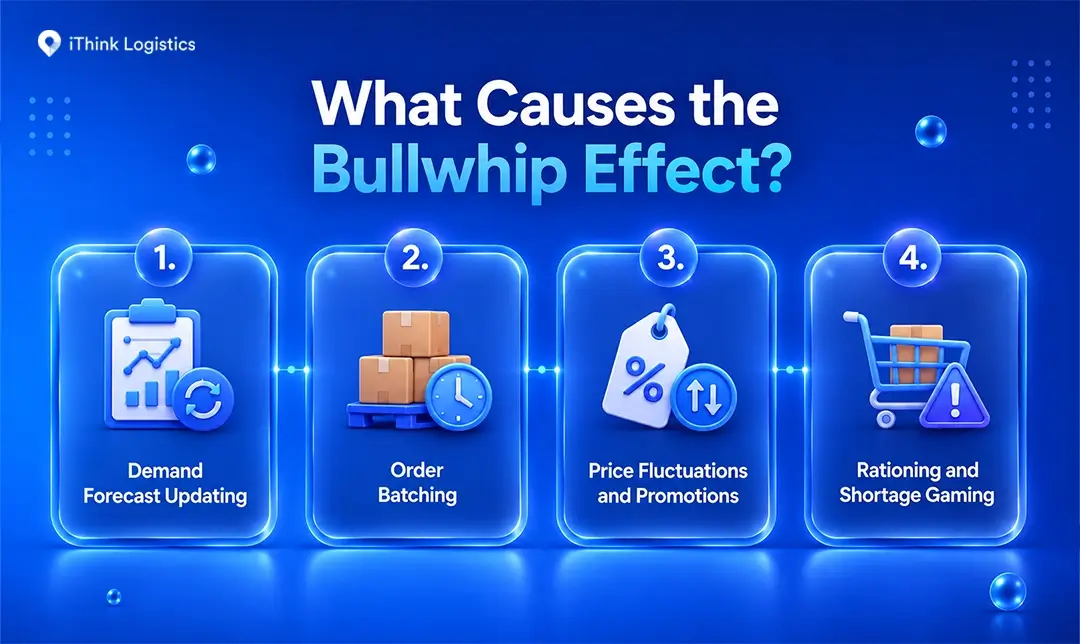
1. Demand Forecast Updating
Also called demand signal processing. In simple words, each business in the chain makes its own guess about future demand, based on the order it just got, not the actual customer sale behind it.
A retailer sees a busy week and orders extra to be safe. The wholesaler sees that bigger order, assumes demand is genuinely rising, and orders even more from the manufacturer.
2. Order Batching
This shows up when businesses place large, infrequent orders instead of smaller, regular ones.
A seller who reorders stock once a month, instead of every few days, creates a spike every time the seller places an order. Suppliers can mistake it for a demand signal instead of a scheduling habit.
3. Price Fluctuations and Promotions
Steep discounts push buyers to forward-buy. A retailer stocks up well beyond normal need to catch a promotion, and orders often crash right after it ends, leaving suppliers who ramped up production stuck with the excess.
4. Rationing and Shortage Gaming
This kicks in during supply crunches. If a supplier says it can fulfill only part of every order, buyers start ordering more than they actually need to end up with their real requirement after the cut.
Once the shortage clears, those inflated orders disappear almost overnight.
Poor information sharing and long or uncertain lead times don’t make this list of four, but they sit right next to it, since both can make demand signals harder to interpret and increase supply chain variability.
A supplier working without real sales data is forecasting half-blind. A longer or more uncertain lead time can encourage a business to carry more safety stock or adjust its orders to protect against shortages.
These four causes form the classic framework behind the bullwhip effect in supply chain management, and the same pattern shows up in Indian D2C fulfillment too, just wearing a different costume.
The Bullwhip Effect and Indian D2C Ecommerce
Here’s a version that plays out closer to home, even if it isn’t quite the textbook case.
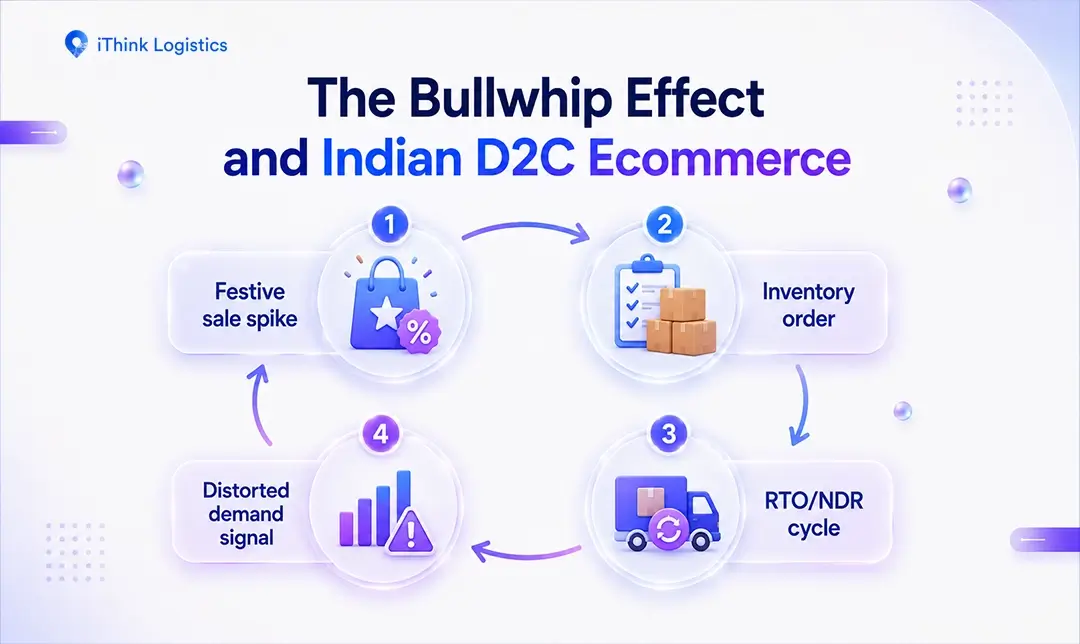
Imagine a seller heading into a festive sale like Big Billion Days. Customer orders surge fast in the days right before and during the event, as shoppers buy to catch the discounts.
Seeing the surge grow day by day, the seller assumes it will keep climbing and places one large inventory order with their supplier, sized for a trend they expect to continue, not just the sale itself.
But once the sale ends, customer orders drop back to normal. The seller is now sitting on stock bought for demand that was only ever going to last as long as the discount did.
On top of that, some of those festive orders come back as RTO (return to origin), because a PIN code turned out to be unserviceable, a customer refused COD at the door, or a delivery attempt failed and got logged as an NDR (non-delivery report).
Those failed deliveries flow back into the seller’s system. If new orders and returned shipments aren’t clearly separated in the planning data, the seller’s view of real demand gets distorted right when it matters most.
That distortion isn’t the bullwhip effect in the strict textbook sense. RTO and NDR are fulfillment and returns problems, not the order-variance mechanism the original research describes.
But it teaches the same lesson: a business that reacts to a distorted signal instead of the real one ends up overcorrecting, and that overcorrection ties up working capital right when post-sale cash flow is already tight.
Effects of the Bullwhip Effect on Supply Chains
The fallout tends to stack up the further you get from the actual customer:
- Excess inventory ties up working capital in stock nobody’s currently buying.
- Stockouts can show up in a different part of the network at the same time, since surplus and shortage rarely land in the same warehouse.
- Higher costs can come from rushed shipping, overtime labor, and last-minute storage.
- Weaker customer service can follow when inventory or delivery commitments are affected.
- Strained supplier and 3PL relationships can build up over time, as constant swings make planning harder for everyone.
Get the causes under control, and most of this fallout shrinks with it. But the bullwhip effect isn’t the only direction distortion can travel in.
What Is the Reverse Bullwhip Effect?
The reverse bullwhip effect runs the opposite direction of the traditional pattern. Instead of order variability growing as you move upstream, it grows as you move downstream, and it can occur after a supply disruption and the ordering behavior that follows it.
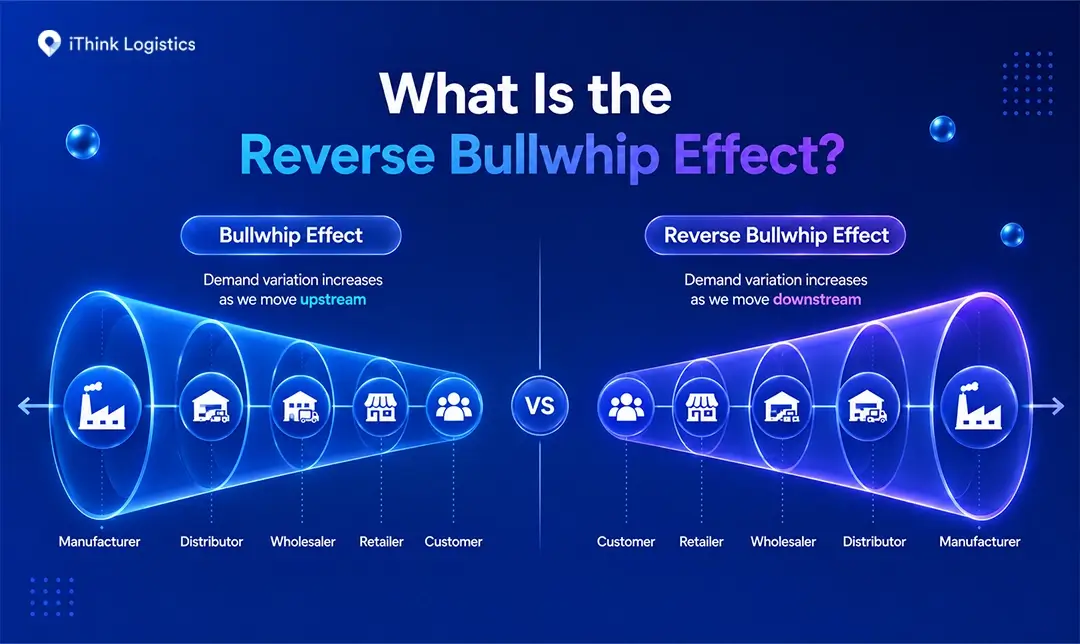
Picture a supplier hit by a shortage. Instead of one steady adjustment, the disruption ripples down through distributors and retailers, each one reacting a little differently, and the swings get bigger the closer you get to the customer.
It’s a related problem, not the same one, and worth knowing the difference before you diagnose either.
Whichever direction the distortion runs, better visibility into what’s actually happening is an important starting point for fixing it.
How to Reduce the Bullwhip Effect
None of these fixes wipe the effect out completely, but each one shrinks it.
Share Information Through VMI and CPFR
Vendor-Managed Inventory cuts down on guesswork. P&G and Walmart built their relationship around this idea: shared sales and inventory data let P&G replenish based on what was actually selling, not just on the orders Walmart placed.
Collaborative Planning, Forecasting, and Replenishment (CPFR) takes that a step further by getting suppliers and retailers to work off one shared forecast instead of two separate guesses.
Keep Pricing Steady
Everyday Low Pricing keeps discounts steady instead of swinging between full price and deep promotions, which takes away much of the reason to stock up early.
Shorten Lead Times
The longer a reorder takes to arrive, the more a business can feel pressure to pad its order just in case. Cutting that wait time can reduce the padding too.
Order Smaller and More Often
Smaller, more frequent orders replace one big monthly spike with a steadier, more honest read of what’s actually being bought.
Most of these fixes depend on the whole chain agreeing to share information. Some of the groundwork, though, starts with getting your own fulfillment data clean first.
How iThink Logistics Helps With Demand and Fulfillment Visibility
Fixing the bullwhip effect at the chain level takes cooperation between every partner involved. No single tool solves that alone.
But a big part of the distortion inside Indian D2C fulfillment specifically comes from messy visibility into what’s actually happening with an order after it ships.
iThink’s AI-driven NDR tool tracks the exact reason a delivery failed, automates reattempts, and updates sellers in real time instead of leaving them to guess.
If a failed delivery and a genuinely new order aren’t clearly separated in a seller’s data, they can be harder to interpret correctly.
Cleaner fulfillment data doesn’t fix the bullwhip effect by itself, but it can give sellers better visibility into delivery problems and support better operational decisions.
FAQs
What is the bullwhip effect in supply chain management?
It’s when small shifts in customer demand turn into much bigger swings in orders and inventory as that information moves from retailers up to manufacturers.
What is an example of the bullwhip effect?
A retailer sees a small sales bump and orders a bit extra to be safe. The wholesaler sees that bigger order, assumes demand is genuinely rising, and orders even more from the manufacturer, who ramps up production well beyond what real demand needs.
What causes the bullwhip effect?
Four classic causes are demand forecast updating, order batching, price fluctuations and promotions, and rationing or shortage gaming. Poor information sharing and long or uncertain lead times can make the problem harder to manage.
How do you reduce the bullwhip effect in a supply chain?
Share real sales and inventory data with suppliers, shorten lead times where you can, keep pricing steady instead of running frequent promotions, and place smaller, more frequent orders instead of a few large ones.
What is the difference between the bullwhip effect and the reverse bullwhip effect?
The bullwhip effect increases order variability as you move upstream toward manufacturers. The reverse bullwhip effect increases order variability as you move downstream, often after a supply disruption.
Is the bullwhip effect bad for a business?
Generally, yes. It tends to lead to excess inventory, stockouts, and higher costs, even though every individual decision along the way usually feels reasonable at the time.
How do you calculate the Bullwhip Ratio?
Divide the variance of the orders you place upstream by the variance of your actual end-customer demand. Anything above 1 means your order variability is higher than your demand variability.
How does the bullwhip effect show up for Indian D2C sellers?
For example, in a seller’s operations, festive sale spikes combined with RTO and NDR cycles can distort a seller’s view of real demand if new orders and returned shipments aren’t tracked separately, leading to the same kind of overcorrection the bullwhip effect describes.
What is the origin of the term bullwhip effect?
The underlying dynamics trace back to Jay Forrester’s work on industrial systems. Procter & Gamble’s Pampers supply chain became one of the best-known examples, and researchers Lee, Padmanabhan, and Whang formalized the causes behind it in a 1997 paper.
Can technology fully eliminate the bullwhip effect?
No single tool eliminates it, but better demand data, shared forecasting, and improved supply chain visibility can help reduce the distortion.
Getting Ahead of the Bullwhip Effect
The bullwhip effect rarely announces itself. It shows up quietly, as a slightly bigger order here, a slightly padded forecast there, until a business is sitting on inventory it can’t explain or scrambling to meet demand that was never really there.
The businesses that manage it best aren’t the ones that eliminate it, since nobody does that.
They’re the ones that catch the distortion early, whether it’s coming from a forecasting error four supply chain tiers away or from a fulfillment dashboard that isn’t separating new orders from returned ones.
Better visibility, shared data, and a willingness to question a sudden spike before reacting to it go a long way toward keeping the whip from cracking too hard.